The Future of Broadband Maps

I read that an AI expert at a workshop hosted by the FCC and the U.S. National Science Foundation suggested that AI could be used to produce better broadband maps. I had to chuckle at that idea.

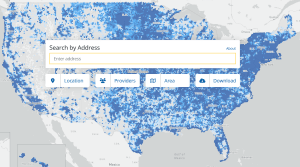
The primary reason for my amusement is that FCC maps are created from self-reported broadband coverage and speeds by the many ISPs in the country. ISPs have a variety of motivations for how and why they report data to the FCC. Some ISPs try to report accurate speeds and coverage. People may be surprised by this, but some of the biggest telcos, like CenturyLink and Frontier, seem to have gotten better at reporting DSL speeds – in some markets, you can find DSL capability being reported at a dozen different speeds to reflect that DSL speeds vary by the distance from the central office.

Other ISPs take the exact opposite approach and report marketing speeds that are far in excess of the capability of the technology being deployed. It’s not hard to find WISPs claiming 100 Mbps to 300 Mbps download capability when they are delivering speeds in the 10 Mbps to 30 Mbps range. My guess is that some of these ISPs are using the FCC maps as an advertisement to get customers to call them after looking at the FCC map. Some ISPs have already been accused of over-reporting speeds to try to block grant money from overbuilding them.

There are also endless examples of ISPs reporting coverage that doesn’t exist. The FCC mapping rules say that only locations that can be served within ten business days should be included in broadband coverage areas, and many ISPs are claiming much larger areas than they can serve quickly. Even worse, some ISPs claim coverage in areas that they can’t serve, such as when WISPs claim coverage of homes that are blocked from line-of-sight by hills or other impediments.

The only way that AI could be used to improve the maps is if the FCC gets serious about mapping and changes some rules, and enforces others. The FCC would have to eliminate the ability of ISPs to claim marketing speeds, which provides easy cover for overstating capabilities. The FCC would also have to get serious about enforcing coverage to meet the 10-day installation rule. If those two changes were made and enforced, the FCC might be able to use AI to improve the maps. AI could match claimed ISP coverage to speed test data and also reference and compare coverage to complaints and challenges from consumers. I don’t see the FCC ever being willing to get that aggressive with ISPs – because this process would be extremely contentious.

I don’t believe any of this will ever happen because after the wave of BEAD funding is finally spent, the FCC and everybody else is going to lose interest in the broadband maps. Nobody will care if some ISP overstates capabilities in an area as long as the BEAD winner is going to bring faster broadband.

There are already a number of State Broadband offices that are saying that the BEAD allocations are not going to be enough to fix broadband everywhere. My prediction is that states that care about fixing the remaining places will create their own broadband maps and will go back to ignoring the FCC maps.

The FCC won’t care. At the point where they can say with a straight face that 95% of homes will be be able to buy broadband that meets the FCC’s definition of broadband, the FCC is going to declare job done. For the last decade, the FCC has issued annual broadband reports to Congress that have said that the state of broadband is good and improving – all based upon maps that everybody knew were grossly overstated in both broadband speeds and coverage. I can’t see the FCC putting extra effort into proving that there are still homes left without good broadband.

Our Fixation on 25/3 Mbps

Mike Conlow wrote a recent blog on Substack that discusses how cellular companies are reporting large numbers of passings on the FCC maps as having the capability to receive exactly 25/3 Mbps or 100/20 Mbps.

Mike uses the example of North Carolina to highlight the issue. In the previous FCC map, UScellular claimed 1.13 million locations in the state that could receive speeds of 25/3 Mbps for fixed cellular broadband. In the latest map, UScellular dropped this number to 224,000 locations. T-Mobile made a similar claim, but only dropped claims of 25/3 Mbps capability from 1.06 million to 1.04 million.

That isn’t a very fast broadband speed, so why does this make any difference? It turns out that the NTIA is using the number of locations with speeds under 25/3 Mbps to allocate the $42.5 BEAD grant dollars between states. I happen to know that North Carolina has an aggressive mapping team that no doubt leaned on UScellular to fix its maps. But other states are probably not as aggressive and are losing a lot of BEAD grant dollars if they didn’t fix similar claims.

The problem is that, in many cases, the claimed speeds are not true. The technologies that I see claiming exactly 25/3 Mbps speeds include DSL, fixed cellular broadband, and fixed WISP broadband. It’s not hard to find examples where cellular companies and WISPs are claiming identical speeds across large geographic areas. That’s not how wireless technologies works. Speeds steadily decrease with the distance between a customer and a tower. Even if these ISPs are being truthful about the speeds that can be delivered close to towers, these speeds are exaggerated for customers farther from towers. It sounds like UScellular in North Carolina might have acknowledged the physics in lowering its claims.

It’s important to point out that any ISP claiming 25/3 Mbps is probably doing nothing wrong under the FCC mapping rules. The FCC allows ISP to report marketing speeds instead of trying to report accurate actual speeds. As long as an ISP is advertising speeds of ‘up to 25/3 Mbps’, it is not breaking the FCC mapping rules.

The title of this blog calls this a fixation on 25/3 Mbps. This particular problem was created when the politicians that wrote the BEAD grant (and other federal grants) rules tied eligibility for funding to the FCC maps and to specific speeds. This is an incredibly shortsighted idea because, by definition, the FCC’s allows ISPs to overstate speeds.

I have no doubt that tying grant eligibility to the FCC maps was done at the prompting of the biggest ISPs who undoubtedly helped to write the BEAD grant rules. The other speed used to define grant-eligible areas is 100/20  Mbps. That speed was chosen for the BEAD rules after a lot of political wrangling. The 100/20 Mbps speed was chosen to provide cover to cable companies to avoid the risk of being overbuilt by BEAD grants. Even if a cable company isn’t quite delivering an upload speeds of 20 Mbps, it can avoid entanglements with grants by declaring in the FCC maps it is meeting that speed.

It’s hard to understand the motivation of an ISP that claims 25/3 Mbps broadband when it knows it is delivering something slower. In this case, the overstatement of speed means that a state will get less BEAD grant funding – something the ISP might be interested in receiving. A claimed speed of 25/3 doesn’t make an area ineligible for grant funding – it just reduces the funding the state will receive. I suspect most ISPs claiming 25/3 Mbps are just declaring the marketing speed and don’t have any other hidden agenda.

While false claims of ISPs delivering 25/3 hurt the amount of BEAD funding coming to a state, the real problem comes from ISPs that falsely claim to be able to deliver 100/20 Mbps broadband. Under the BEAD and other federal and state grant rules, such areas are considered as served and grant money can’t be used to compete in these areas. All an ISP has to do to keep away grant competition is to claim a marketing speed of 100/20 Mbps. I think many of the ISPs making claiming 100/20 Mbps know exactly what they are doing – they are trying to fend off faster competition.

To me, this is akin to when CenturyLink and Frontier changed the claimed speeds in tens of thousands of Census blocks right before the FCC determined the areas eligible for RDOF. The FCC rejected those last-minute changes, which were blatant attempts to protect monopoly rural areas from the RDOF funding.

Just as an aside, the FCC supposedly was going to make RDOF available to all unserved locations in the country. Even with the above reporting issues that are badly suppressing the count of unserved locations, there are still 8.3 million unserved areas in the country, according to the latest FCC maps. The fact that RDOF missed 8.3 million eligible locations is probably the best example of why grants and subsidies should never be tied to the FCC broadband maps.

I have a simple fix for the current situation. If I was the NTIA, I would make one simple change before allocating BEAD dollars. I’d reduce every claimed speed of exactly 25 Mbps broadband to 24 Mbps. I’d then invite ISPs to prove they can meet the 25/3 speed.  I would do the same and reduce every claim of exactly 100 Mbps download to 99 Mbps when defining grant eligible areas. My guess is that this change would produce more accurate maps than the ones we have now. I’d give ISPs plenty of time to claim that the adjustment is wrong – which would be a better conversation than the flurry of map challenges we’re now seeing.

However, while this idea has appeal, it would be another rule based on our fixation of defining broadband with a specific speed number.

The Latest FCC Maps

As promised, the FCC released a new set of maps on May 30. These are supposed to be the maps that will be used to allocate the $42.5 billion in BEAD grant funding to states. Broadband analyst Mike Conlow quickly published a blog on Substack about the new mapping data that includes a summary of the new map in easy-to-understand tables. Mike’s summary shows that there are more than 114.5 million broadband passings in the country – locations that could be broadband subscribers). That’s an increase of over 1 million locations since the last version of the FCC maps.

More importantly, the new maps can be used to count the number of households that can buy broadband at various speeds. The $42.5 billion in BEAD grant funding will be allocated to states according to the number of unserved locations – places that can’t buy broadband at a speed of at least 25/3 Mbps. Locations are underserved if there is an ISP that offers broadband between 25/3 Mbps and 100/20 Mbps. According to Mike’s quick math, there are 8.67 million unserved locations and 3.55 million underserved locations. Mike subsequently corrected the number of unserved locations to 8.3 million.

Anybody who is intimately familiar with the FCC maps knows that there is a lot of fiction buried in the reporting. There is one huge flaw in the FCC mapping system that has carried over from the previous FCC mapping regime – ISPs self-report the speeds they can deliver. Per the FCC mapping rules, ISPs can claim broadband marketing speeds rather than some approximation of actual speeds. In every county where I’ve delved deep into the local situation, I’ve found multiple ISPs that are overclaiming broadband speeds.

ISPs vary widely in how they report broadband speeds to the FCC. I see some ISPs who meticulously categorize customers into a dozen or more speed tiers. It’s fairly obvious that these ISPs are trying to accurately show the speeds that are available. But there are also ISPs that claim the same speed over a large geographic area. In today’s world, I’m always instantly suspicious of any ISP that claims exactly 100/20 Mbps broadband since that conveniently classifies those locations as served. An ISP making that claim is telling the FCC that everybody in their service footprint already has adequate broadband and that there is no need to give grant money to anybody to compete with them.

But such a claim is ludicrous if the ISP is deploying a technology like DSL, cellular wireless, or fixed wireless where it is impossible that every customer over a wide geographic area to get the ISP’s top claimed speed. Such claims are easy to debunk when you look closely. For example, customers only a few miles from a DSLAM or a tower can’t get the fastest speeds. There are multiple reasons why a given customer’s speed might be slower. Such claims are even more quickly debunked when looking at detailed Ookla speed tests.

A second flaw in the FCC maps is the coverage areas claimed by ISPs. The FCC is counting on public broadband challenges or challenges by State Broadband Offices to somehow fix this problem – but that’s an unrealistic hope. Most people don’t know about the FCC maps and the challenge process – and even people who know about it are not motivated to file a challenge about an ISP that claims service at their home that’s not really available. This issue can apply to any technology, but it’s particularly a problem for WISPs and cellular broadband. It’s not easy for a knowledgeable engineer to accurately judge the coverage area of a wireless network from a given tower – I have to think it’s beyond the capability of the folks at a State Broadband Office to understand it enough to challenge coverage. But it doesn’t take any expertise to know that a WISP or a cellular company claiming ubiquitous 100/20 Mbps coverage across large areas is exaggerating both speed and coverage capabilities.

It’s going to be interesting to see how States react to these final counts. There have been rumors about states ready to sue the FCC and the NTIA if they feel these maps will cheat them out of funding. There has been legislation introduced in the Senate that would force the NTIA to wait longer for better maps before allocating most of the funding. It’s going to be surprising if nobody pops up to challenge the allocation of the $42.5 million dollars. A challenge could pluge the BEAD grants into huge uncertainty.

An even bigger issue is if the FCC maps will be used to determine the locations that are grant eligible – because that would be a travesty. That would mean that every ISP that claims a bogus 100/20 Mbps broadband coverage will be rewarded by keeping out competition from grant funding. Regardless of how the funding is allocated to States, Broadband Offices need to be the ones to determine which locations in their State don’t have good broadband.

Will the FCC Maps Get Better?

It is unfortunate timing that the new FCC maps were issued in the middle of the process of trying to determine the BEAD grant funding. Congress said that the amount of funding that will go to each state must be based upon the FCC maps – and the first draft of the FCC maps is clearly flawed. The FCC maps whiffed in many cases in counting the location of homes and business, and too many ISPs have clearly exaggerated both the coverage and the broadband speeds that are available to customers. This really bollixes the BEAD grant allocations, but I don’t know anybody who thought the first version of the new maps would have any merit.

Assuming that that grant funding question gets resolved somehow, there remains the bigger issue of whether the new FCC maps will ever accurately portray broadband availability. Is there any hope for these maps to get better? Getting better maps requires improving the three basic flaws of the new FCC maps – the mapping fabric that defines the location of possible customers, the claimed coverage that defines where broadband is available, and the broadband speeds available to customers.

The mapping fabric will get better over time if state and local governments decide this is something that is important to fix. Local folks understand the location of homes and businesses far better than CostQuest. But there are two reasons why the fabric might never be fixed. First, many rural counties do not have the staff or resources to tackle trying to fix the mapping fabric. There are still a lot of counties that don’t have a GIS mapping system that shows the details of every home, business, land plot, etc. But counties with GIS systems are not easily able to count broadband passings. Questions like how to count cabins or farm buildings are always going to be vexing. One of the flaws of asking local governments to fix the maps is that local governments don’t spy on citizens to see which homes are occupied or how many months a year somebody uses a cabin. My bet is that once the BEAD funding has been allocated that state and local governments will quickly lose interest in the FCC mapping fabric. I expect a lot of counties will refuse to spend the time and money needed to fix a federal database.

The FCC has held out hope that the coverage areas claimed by ISPs will become more accurate over time. One of the new aspects of the FCC maps is an individual challenge by any homeowner who disputes that a given ISP can deliver broadband to their home. If Comcast incorrectly claims a home can get broadband, the homeowner can challenge this in the FCC map – and if the homeowner is correct, Comcast must fix its mapping claim. But I have to wonder how many homeowners will ever bother to tackle a broadband challenge. The real kicker is that there is no big benefit to a homeowner to make the challenge. Using this example, Comcast would fix the map, but that doesn’t mean that Comcast is likely to offer broadband to the homeowner who challenged the map – it just means the map gets fixed. Once folks realize that a challenge doesn’t change anything, I’m not sure how many people other than the broadband diehards will care much.

The coverage challenge is only going to get better if ISPs report honestly. Using this same example, there would not be much improvement in the FCC map if Comcast were to fix a false speed claim for a specific homeowner challenge unless Comcast was to fix the maps for neighboring homes – something that a challenge does not require.

The issue that most people care about is broadband speeds. Unfortunately, the new maps are as badly flawed on this issue as the old ones – maybe worse. ISPs are still allowed to claim marketing speeds instead of some approximation of actual speeds – and an ISP gets to define what it means by marketing speeds. For example, it’s hard to dispute a marketing speed if it’s something the ISP displays on its website.

Other than the challenge process, there is another possible remedy for fixing mapping problems. The Broadband Deployment, Accuracy, and Technology Availability (DATA) Act that created the new maps gives the FCC the ability to levy fines against ISPs that knowingly or recklessly submit inaccurate mapping data. But does anybody really think that the FCC is going to fine some small local WISP that exaggerates broadband speeds? I have a hard time thinking that the FCC will ever wade into the issue of disputing claims of marketing speeds versus actual speeds. Doing so would just highlight the fact that reporting marketing speeds is acceptable under the FCC rules.

The State of Vermont reacted quickly to the new FCC maps and showed the extent of the problems. The State sent a challenge letter to the FCC saying that 11% of the locations in the FCC mapping fabric don’t exist. Worse, Vermont says that 22% of locations are missing from the FCC map. Vermont also said the speeds portrayed in the new maps don’t align with its own local mapping effort. The new FCC map shows that over 95% of Vermont homes have access to broadband of at least 100/20 Mbps. The State’s broadband maps show that only 71% of homes in the state can receive broadband at 100 Mbps or faster at the end of 2021.

I really hate to say this, but I doubt that the new maps will ever be significantly better than the old ones. I don’t enjoy being pessimistic, and I should probably let the various challenge processes run the course before complaining too loudly. I think after the flurry associated with allocating the BEAD grant funding ends that most people and local governments will quickly lose interest in the map challenge process. I can’t think of any reason why ISPs won’t continue to misreport broadband speed and coverage if they think it somehow benefits them. And I’m doubtful that the FCC will take any meaningful steps to make the maps better.

Dates for the New FCC Mapping

The FCC just announced that ISPs must file new mapping data with the FCC by September 1. The portal for accepting the new mapping data will open on June 30. The FCC cautioned that it could accelerate the final due date before September 1.

The FCC is under tremendous pressure to implement the new mapping data because the Infrastructure Investment and Jobs Act legislation is basing the $42.5 billion BEAD grant program on the FCC maps. The FCC may move the date sooner depending upon the resolution of a challenge by LightBox to the award of the mapping software creation to CostQuest. If that gets resolved sooner, the FCC is likely to require that new mapping information be filed sooner.

The new mapping data will be submitted in the form of shapefiles that are supposed to precisely define where ISPs have active customers today or are capable of implementing a request for new service within ten working days. Every ISP in the country is supposed to create and submit these maps by the FCC’s due dates.

I’m highly skeptical that the first round of the new maps will be correct. It’s not easy to get these maps right in rural America, where the maps should reflect the ability to serve a given house, but not the neighbor. I think the first set of reporting under the new maps will include tons of errors just from the inability of ISPs to get coverage areas to fit the new rules. ISPs will get better at this – but expect some big problems the first time that ISPs try this.

The new maps, if done right, will require cable companies to identify the last house served on their networks on every street and road leaving every town that is served by a cable company. I’m guessing that’s a whole lot of work if the cable companies didn’t create detailed electronic maps of service areas over the years. I must give the FCC credit on this one issue because there are homes just past the edge of every cable company that the current FCC mapping shows as being served, but which aren’t. I won’t be surprised if cleaning up the reporting at the edges of cable companies won’t show a half-million homes that can’t buy fast broadband.

The group with the biggest challenge is WISPs. If this is done right, a WISP must basically show a map of the coverage area from each antenna that reflects areas that can’t be served due to obstructions like hills. I have no idea how a WISP will determine who can be served in ten days in places with trees and foliage. The process most WISPs undertake with a prospective new customer is to visit and see if the customer can get a signal – they often don’t really know until they try. The old maps required WISPs to guess if they could reach a Census block – now they are expected to map exact coverage areas.

A bigger question is if ISPs want to tell the truth about coverage. For example, I know of a Western WISP that claims 100% coverage of two adjoining counties when the WISP operates from a single radio on top of a mountain. The area claimed as coverage by this WISP is 90% fiction, and I have to wonder if this WISP or the many other ISPs that exaggerate broadband coverage, are going to come clean just because the FCC implements a new reporting system? Is the FCC really going to climb into the weeds to understand the local details of the coverage areas for rural ISPs? The FCC has the power to impose fines and penalties for ISPs that file incorrect coverage data – but it has only exercised this authority a few times.

To me, the biggest concern of the new mapping is the FCC’s intentions on how to use the mapping data. It’s clear that the revised FCC maps are supposed to identify households that can’t buy broadband at speeds of at least 25/3 Mbps or of 100/20 Mbps. It’s possible that the FCC can fix the problem of exaggerated coverage areas, but this likely will take years to sort out. But the FCC has already set itself to fail for its primary objective by still allowing ISPs to exaggerate broadband speeds. ISPs are still allowed to report marketing speeds, meaning they can largely make up any broadband speed story they want to tell.

Rural communities are going to rightfully be irate when the much-awaited new maps don’t change the blatantly exaggerated broadband speeds. The first draft of the new maps will still include exaggerated coverage areas, and it might take years of concentrated effort by the FCC to clean up coverage reporting. But I can’t see any way that the new maps will fix the speed story.

The FCC has created a false expectation that the first round of new maps will clean up all of the reporting sins of the past. They’ve been promising Congress that the new maps will be better – and they might be. To us in the industry, marginally better maps would be a great first step. But that’s not what the FCC says is coming. I predict a firestorm when everybody realizes that many of the old mapping problems have been translated into the new maps.

We Need Penalties for Bad FCC Mapping Data

The FCC has been in the process of implementing revised mapping that will fix a lot of the problems with the current 477 broadband reporting process. The needed changes should be further boosted by the Broadband DATA Act that was signed into law on Monday. The new mapping will use polygons, and ISPs are supposed to show precise coverage areas for where they offer or don’t offer broadband.

If ISPs do this correctly – and that’s a big if – then this will fix at least one big problem that I call the town boundary problem. The current FCC data gathering asks ISPs to report the fastest speed they can deliver in a census block. Unfortunately, census blocks don’t stop at town boundaries, and so the FCC databases regularly assumes that all of the people outside of town can receive the same speeds as people inside the towns. If cable companies and fiber providers draw honest polygons that stop where their network stops, this boundary issue should disappear.

Unfortunately, the benefits of the new mapping are not so clear cut in rural areas. DSL providers and fixed wireless providers are also supposed to draw polygons. The rural polygons are supposed to only cover existing customers as well as places that can be connected within ten business days of a customer request for activation.

I’ve been spending a lot of time lately looking through the claimed coverage on Form 477 by telco DSL and WISPs. Some of the things I see in the FCC database are massively erroneous and I’m not convinced that rural ISPs will clean up their act even if they are forced to use the polygons. Consider a few examples:

  • I’ve been working with a sparsely populated county that has large rural census blocks – which is pretty normal. The incumbent telco claims 25/3 Mbps coverage for almost all of the rural areas of the county. We’ve been working with the county to have residents perform speed tests and have seen almost no speeds faster than 5 Mbps, with some speeds on DSL below 1 Mbps. The incumbent telco does widely offer DSL, but the claimed 25/3 Mbps capability reported to the FCC is pure fantasy.
  • I’m working with another rural county where two WISPs claim to provide 100 Mbps wireless service covering the whole county. The WISPs don’t operate towers in the county and their nearest towers are in a nearby county. The county has undertaken a large canvass of residents to identify the ISPs in the county and so far hasn’t found even one customer of these WISPs. Even if they find a few customers, the WISPs can’t deliver 100 Mbps wireless broadband from towers more than 10 miles away – it’s doubtful they deliver that much speed even next to the existing towers.

I am not convinced that the revised FCC mapping is going to fix these two situations. The incumbent telco is going to say that they can install DSL within ten business days everywhere in the county – so they might not shrink their claimed coverage when going to the polygons. The problem with the telco isn’t the coverage area – it’s the claimed speeds. If the new FCC reporting still allows ISPs to overstate speeds, then nothing will be fixed in this county with the new mapping.

The two WISPs have a double problem. First, the coverage area of the two WISPs seem to be highly exaggerated. The WISPs are also exaggerating the broadband speeds available and there is zero chance that the WISPs are delivering speeds even remotely close to 100 Mbps broadband from a distant tower. These WISPs seem to be guilty of overstating both the coverage areas and the speeds. Unfortunately, the WISPs might still claim they can install in this area within 10 business days and might not shrink their claimed coverage. And unless they are somehow forced, the WISPs might not lower the claim of 100 Mbps.

There are real life consequences to the claims made in these two examples. In the first example, the FCC believes the whole county has access to 25/3 Mbps DSL, when in fact it looks like nobody has DSL even close to that speed. The county with the two WISPs is in even worse shape. The FCC considers this county completely covered with 100/10 Mbps broadband, when in fact there is no fast broadband coverage. In reality, the fastest broadband option in some parts of the county is a third WISP that markets speeds of 15 Mbps but mostly delivers less.

The consequences of the current mapping are dire for both of these counties. These counties are not included in the FCC’s eligible areas for $20 billion RDOF grants that was just published because the FCC thinks these counties have good broadband. If the ISP data being reported was honest, both counties would be eligible for these grants. These counties might be eligible for other grants that would allow the grant applicant to challenge the FCC speed data – but such challenges are a lot of work and don’t always get accepted.

I know there are hundreds of other counties in the same situation, and I have little faith that new mapping is going to fix this in rural areas. What is needed are severe fines for ISPs that overstate speed or coverage areas. In this case, the existing ISPs are causing huge economic harm to these counties and the fines ought to be set accordingly. I don’t understand what motivates ISPs to claim speeds that don’t exist – but if we are going to fix rural broadband, we need to start by kicking the bad ISP actors hard in the pocketbook.

The Broadband DATA Act allows for a challenge process so that localities can force honest reporting. The FCC needs to implement this immediately, without more study or delay.

Broadband and the Census

The US government is gearing up to begin the 2020 census which will be administered starting next April 20. For the first time the Census is going to rely heavily on people answering the census questions online. Live census takers will then follow-up with those that don’t submit the online response.

This seems like an odd decision since there are still a lot of people who don’t have home broadband. This seems like a poorly conceived idea by those of us who understand the FCC’s dirty little secret – the FCC has no idea how many homes don’t have broadband.

As a country, we care a lot about an accurate Census. The census data is used for multiple government purposes. The 10-year Census is used to redraw both federal and state political boundaries every ten years. The Census is used to determine the number of US House Representatives allowed for each state. The government uses the Census to allocate the funding for numerous federal programs that allocate funding by population. If an area of the country is undercounted they lose both political representation and federal funding for a wide variety of purposes.

This all means that there is a significant downside risk for any part of the country that is undercounted in the Census. The Census is hiring 175,000 fewer door-to-door people nationwide to follow-up on those that don’t answer the first wave of the Census, and one has to wonder if they are going to be equipped when huge portions of rural America doesn’t respond to the online census request.

As I said earlier, we have no idea as a country how many people don’t have home broadband. According to the FCC maps, there are still 21 million people in rural America with no access to broadband. However, everybody understands that this number is understated due to the idiotic rules used to count broadband customers by the FCC. We use a self-reporting system where ISPs tell the FCC about their broadband coverage. We know that many ISPs have overstated the speeds they can deliver along with the areas of their coverage. That’s bad enough, but the FCC then compounds this error by assuming that if a census block has at least one broadband customer that the whole block has broadband. A census block is normally 600-800 homes and anybody living in rural America understands how large such an area can cover.

We have other people counting broadband that paint a very different picture than the FCC. The one with the widest reach and most credibility is Microsoft. They are able to measure the speed of downloaded software upgrades – a method that tells the real broadband situation at a home. Microsoft estimates that 162 million people in the US don’t have access to broadband that meets the FCC’s definition of 25/3 Mbps. But Microsoft has no way of counting homes with no broadband.

This is not just a rural problem. It’s always been suspected that there are millions of homes in older urban areas that don’t have access to broadband. There are apartments and little pockets of neighborhoods everywhere that were bypassed by the cable companies when they built their networks in the 1970s and 80s. Folks who study this issue estimate that there could be as many as 10 million people in urban areas without broadband access.

Even more importantly, there are millions of people that elect not to buy broadband or who access the Internet only using a cellphone. There are still homes everywhere that either can’t afford the Internet or who refuse to go online. Even among houses with broadband there are going to be many who don’t have good enough computer skills or the language skills to find and complete the Census questions online.

My guess is that the Census Bureau is going to be totally overwhelmed by the levels of non-response of households that don’t take the Census online. There will be huge geographic rural areas where few people respond online. There will be people everywhere who don’t have access to broadband or are unable to navigate the online questionnaire.

In the past the US Census Bureau believes they got a pretty high response. They got a decently high response from households that completed the paper census forms and had an army of census takers that tracked down houses that didn’t respond. If the completion ratio for the Census slips even a few percent, then areas without good broadband are likely to be disadvantaged in the many ways that Census data affects states.

The Census was moved online to save money. I think that the decision to go online is probably ten years premature and that the Census Bureau is probably totally unprepared for what’s going to happen next April. I hope I’m wrong.

FCC Modifies Broadband Mapping Parameters

Last week the FCC decided to change the method of collecting data to support its broadband maps. It’s widely understood that the current mapping system badly misstates broadband coverage. That’s a big problem since the FCC uses the faulty broadband mapping data to make decisions like determining eligibility for broadband grants.

The most important new change is that ISPs have to produce mapping ‘polygons’ to show where they have existing customers. The ISP polygons can cover areas without current customers only where an ISP “has a current broadband connection or it could provide such a connection within ten business days of a customer request and without an extraordinary commitment of resources or construction costs exceeding an ordinary service activation fee.”

The new polygons fix one of the big flaws in the current broadband map. The polygons are going to make a noticeable difference when showing coverage for a cable company or a fiber-to-the-home network. Those networks have hard boundaries – there is always a last home served at the edge of the service area after which nobody else is covered. Today’s mapping by census block doesn’t recognize the hard boundaries of these networks and often counts customers outside these networks as having access to fast data speeds. This is particularly a problem in rural areas where a large area outside a small town might be counted as having 100 Mbps or faster broadband when there is no broadband.

Unfortunately, I don’t see the new maps making a big difference for the rest of rural America unless the ISPs providing DSL and fixed wireless service get scrupulously honest with reporting.  I contend that it is difficult, and perhaps impossible to accurately map these technologies – particularly for disclosing the broadband speed available at a given customer location.

Consider DSL. There are several factors that affect the speed of a DSL product. The one everybody knows is that the amount of delivered bandwidth decreases with distance from the DSLAM (the DSL core modem). However, the quality of DSL performance also depends upon the gauge of the copper serving a customer (there are different sizes of copper in a network), the quality of that copper (copper deteriorates over time), issues with the drop wire (drop wires can suffer from a variety of issues separate from issues in the network), the age and type of DSL electronics (there is still plenty of DSL from the 1990s), and the telco technology used on a given copper route to boost or extend signals. There are also customers who can’t get DSL due to the simple issue that a telco has no spare pairs of copper with which to serve them.

It is not unusual for two customers who are side by side to have a drastically different DSL experience – one might have a decent speed and one might not be able to get any DSL service. There is no way for a telco to reflect these highly local conditions on a broadband map. I’m doubtful that the big telcos even track the speeds available to existing customers. The telcos can’t know anything about homes that don’t have their service today.

The same goes for fixed wireless. Broadband speeds also decrease with distance from the tower. Wireless broadband speeds can vary with temperature and humidity. There is a definite fall-off in speed during precipitation. Wireless broadband using unlicensed spectrum is subject to interference, which can mysteriously come and go. The biggest obstacle for many wireless customers is foliage and other obstacles between a customer and the wireless tower. Just like with DSL, wireless companies don’t have any idea what speed they can deliver to a customer who is not on their network. They usually only know what’s available after climbing on a roof to investigate a connection.

Another big issue the FCC didn’t address is reporting of actual speeds. Our examination of the FCC mapping data for both DSL and fixed wireless shows that many ISPs don’t try to report actual broadband speeds. Instead, we see marketing speeds or something other speed standard being reported. Even if these providers map the polygons correctly, we won’t have a good idea of rural broadband coverage unless the ISPs try hard to report actual speeds. We hear from customers all the time that are being sold a rural broadband product that is marketed to deliver speeds of 10 Mbps, 15 Mbps, or 25 Mbps but which delivers only a few Mbps. If the maps don’t reflect the actual speeds they will still be largely worthless.

One last issue is a head-scratcher. Many rural networks are oversubscribed, meaning there are more customers than can comfortably be accommodated at the busiest usage times on the networks. How do you report the broadband speed for a customer who can get 20 Mbps downloads at 4:00 AM but 3 Mbps in the evening?

I applaud the FCC for finally getting rid of the census blocks. But we can’t pretend that this fix is going to make much of a difference for most of rural America. The rural broadband gap is mostly due to the neglected copper networks of the largest telcos. I can’t imagine any way to ever accurately map DSL and fixed wireless technologies., which means the maps are still going to be terrible in the places we most care about. The FCC is still going to harming rural America if they use the new maps to make decisions for important things like awarding grant money. The only real fix is to throw the maps away for those purposes and do something more sensible. For example, grant money ought to always be available to somebody that wants to build fiber to replace big telco copper – we don’t need a map to know that is good policy.

We Need a Challenge Process for Broadband Maps

We all know that the broadband maps maintained by the FCC are terrible. Some of the inaccuracy is due to the fact that the data in the maps come from ISPs. For example, there are still obvious examples where carriers are reporting their marketing speeds rather than actual speeds, which they might not know. Some of the inaccuracy is due to the mapping rules, such as showing broadband by census block – when a few customers in a block have decent broadband it’s assumed that the whole census block has it. Some of the inaccuracy is due to the vagaries of technology – DSL can vary significantly from one house to the next due to the condition of local copper; wireless broadband can vary according to interference and impediments in the line-of-sight. The maps can be wrong due to bad behavior of an ISP who has a reason to either overstate or understate their actual speeds (I’ve seen both cases).

None of this would matter if the maps were just our best guess at seeing the state of broadband in the country. Unfortunately, the maps are used for real-life purposes. First, the maps are used at the FCC and state legislators to develop and support various policies related to broadband. It’s been my contention for a long time that the FCC has been hiding behind the bad maps because those maps grossly overstate the availability of rural broadband. The FCC has a good reason to do so because they are tasked by Congress to fix inadequate broadband.

Recently the maps have been used in a more concrete way and are used to define where grants can or cannot be awarded. Used in this manner the maps are being used to identify groups of homes that don’t already have adequate broadband. The maps were the basis of determining eligible areas for the CAF II reverse auction and now for the e-Connectivity grants.

This is where bad mapping really hurts. Every rural county in the country knows where broadband is terrible or non-existent. When I show the FCC maps to local politicians they are aghast at how inaccurate the maps are for their areas. The maps often show large swaths of phantom broadband that doesn’t exist. The maps will show towns that supposedly have universal 25/3 Mbps broadband or better when the real speeds in the town are 10 Mbps or less. The bad maps hurt every one of these places because if these maps were accurate these places would be eligible for grants to help fix the poor broadband. A lot of rural America is being royally screwed by the bad maps.

Of even more dismay, the maps seem to be getting worse instead of better. For example, in the CAF II program, the big telcos were supposed to bring broadband of at least 10/1 Mbps to huge swaths or rural America. A lot of the areas covered by the CAF II program are not going to see any improvement of broadband speeds. In some cases, the technology used, such as AT&T’s use of fixed cellular can’t deliver the desired speeds to customers who live too far from a tower. I also believe we’re going to find that in many cases the big carriers are electing to only upgrade the low-hanging fruit and are ignoring homes where the CAF upgrade costs too much. These carriers are likely to claim they’ve made the upgrades on the maps rather than admit to the FCC that they pocketed the subsidy money instead of spending it to improve broadband.

There have been a few suggested fixes for the problem. A few states have tried to tackle their own broadband maps that are more accurate, but they can’t get access to any better data from the ISPs. There are a few states now that are asking citizens to run speed tests to try to map the real broadband situation, but unless the speeds tests are run under specific and rigorous conditions they won’t, by themselves, serve as proof of poor broadband.

The easiest fix for the problem is staring us right in the face. Last year the FCC got a lot of complaints about the soon-to-be-awarded Mobility Fund Phase II grants. This money was to go to cellular carriers to bring cell coverage to areas that don’t have it. The FCC maps used for those efforts were even worse than the broadband maps and the biggest cellular companies were accused of fudging their coverage data to try to stop smaller rival cell providers from getting the federal money. The outcry was so loud that the FCC created a challenge process where state and local governments could challenge the cellular coverage maps. I know a lot of governments that took part in these challenges. The remapping isn’t yet complete, but it’s clear that local input improved the maps.

We need the same thing for the FCC broadband maps. There needs to be a permanent challenge process where a state or local government can challenge the maps and can supply what they believe to be a more accurate map of coverage. Once counties understand that they are getting bypassed for federal grant money due to crappy maps they will jump all over a challenge process. I know places that will go door-to-door if the effort can help bring funds to get better broadband.

Unfortunately, only the FCC can order a challenge process, and I don’t think they will even consider it unless they got the same kind of outcry that came with the Mobility II Funding. It’s sad to say, but the FCC has a vested interest in burying their head in the sand and pretending that rural broadband is okay – otherwise they have to try to fix it.

I think states ought to consider this. If a state undertakes a program to allow challenges to the map, then governors and federal legislators can use the evidence gathered to pressure the USDA to accept alternate maps for areas with poor broadband. These challenges have to come from the local level where people know the broadband story. This can’t come from a state broadband mapping process that starts with carrier data. If local people are allowed to challenge the maps then the maps will get better and will better define areas that deserve federal grants. I believe a lot of county governments and small towns would leap at the opportunity to tell their broadband story.

Upgrading FCC Broadband Statistics

The NCTA – The Internet & Television Association that represents the large cable companies and telcos has filed a complaint with the FCC asserting that the agency is not updating broadband maps in a timely manner, and this is understating the amount of broadband deployed in the country.

They have a good point, in that the FCC recently released broadband data from 2016 while they already have received June 2017 data. The recently released data is now more than two years behind the actual broadband deployments in the country.

There may have been years in the past where this kind of time delay didn’t make that much difference, but we are now at a time when there are massive amounts of broadband upgrades happening across the country. The big telcos are well into the CAF II upgrades that are upgrading huge swaths of rural America to speeds of at least 10/1 Mbps. There is a lot of upgrades at smaller telcos that are implementing upgrades from the A-CAM program that requires upgrades to at least 25/3 Mbps – although many of them are upgrading to fiber with gigabit speeds. We now see cable companies starting to implement DOCSIS 3.01 upgrades that can increase their download speeds to a gigabit. And there are numerous overbuilders upgrading broadband all over the place by building fiber or fixed wireless technology. We will soon see the CAF II reverse auctions building yet more rural broadband, with a significant percentage of those upgrades being at 100 Mbps or faster.

This means that the FCC’s broadband maps and the underlying databases are far out of synch and provide the wrong narrative about broadband coverage. The members of NCTA want to get credit for the upgrades they are making, which means that numerous households are no longer considered as unserved, with many of them getting a broadband option for the first time.

There are practical and policy ramifications due to the delay in upgrading the maps. For example, some of the federal loan and grant programs score applicant projects according to whether they are upgrading rural areas that are unserved or underserved – and the FCC data overstates the households that are classified as unserved.

There are also real-life implications for communities. Consider Otter Tail County, Minnesota. Looking at the current FCC maps shows the County with a paltry 2% of households able to get download speeds of 100 Mbps. That is a truthful depiction just looking back a year or two. The cable companies serving the towns in the County have had maximum speeds of no more than 60 Mbps and the rural areas all have broadband using DSL, fixed wireless or satellite.

However, that map doesn’t reflect what’s happening in the County today and what will be happening there in the next few years. Charter has promised to upgrade to faster speeds nationwide and their customers in the County ought to be at speeds far above the 100 Mbps threshold. A lot of the rural areas are served by small telcos that are using A-CAM funding to build fiber. In this past summer alone there were dozens of construction crews building fiber around the County. There are also a few pockets of the County that have gotten upgrades to fiber that were assisted with broadband grants from the State of Minnesota. My quick assessment show that the County will soon have 100 Mbps broadband for 70% to 80% of households when the known upgrades are finished over the next few years. And even most of the areas not getting 100 Mbps broadband will still be seeing speed improvements. That facts on the ground in Otter Tail County paint a drastically different picture than what is shown by the current FCC maps. I have no doubt that this same thing is true in numerous other rural counties.

I understand that the FCC wants to use actual data to create their maps. But I’m mystified why they don’t want to brag about the programs they have sponsored that will improve broadband. It should be easy for them to overlay a map of the expected upgrades that will come from the CAF II and A-Cam programs. These future-looking maps are a better picture of the rural broadband situation.

There are obviously numerous upgrades happening that the FCC can’t know about – they have no way of knowing about upgrades being done with non-FCC funding. But there isn’t much excuse for the FCC to be issuing data and maps that are more than two years out of synch at the date of publication. It’s not a difficult  technical challenge to quickly map ISP broadband data as it’s submitted – numerous states already readily create their own versions of these maps. And it shouldn’t be hard for the FCC to create overlays showing the upcoming successes due to the upgrades they have fostered.