
Media in general is a major factor in the life of US adults. In the second quarter of this year the average adult spent an average of 10 hours and 45 minutes per day using some form of media. That usage varies by age with adults aged 50-64 at the highest with an average of 11 hours and 49 minutes per day. What might surprise many is that adults aged 18-34 were the lowest demographic at just over 8 hours of media use per day.
The time spent on various types of media is intriguing. Live and time-shifted TV is still king and the average adult watches TV for 4 hours and 21 minutes per day. Next is using apps on smart phones at 2 hours 19 minutes per day. Radio usage is third with an average of 1 hour 49 minutes per day. Smaller categories include game consoles at 44 minutes per day, using tablets at 43 minutes per day and browsing the Internet on a computer at 32 minutes per day.
As we’ve known from the long-time tracking from Nielsen, the hours watching TV varies widely by age group. Adults over 65 watch TV almost 7 hours per day. But a statistic that scares the whole television industry is that adults aged 18-34 are only watching an average of 2 hours per day. There have been several studies over the last few years that concluded that television viewing habits adopted when we are young carry forward for life. Those over 65 are from the generation stretching back to the birth of TV and it’s still an important part of their life, while younger people have chosen other ways to consume media. This doesn’t bode well for the future of TV.
Some other categories of usage have become common for everybody. All adults under 65 now spend between 2 and 3 hours per day using apps on a smartphone. Those over 65 are at about half that usage. Also, average usage of tablets is about 46 minutes per day for everybody over 34, and at 33 minutes per day for those under 34.
Another interesting statistic is how we use media throughout the day. We’re all familiar with the fact that TV usage peaks in the evenings with viewing at prime time double the TV viewing for the rest of the day. But interestingly, the use of combined digital media – smartphones, computers and tablets – is consistent from 8 AM through bedtime.
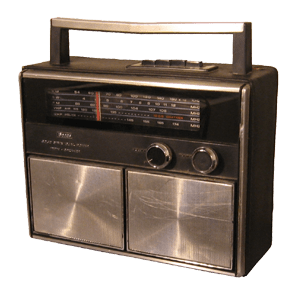
Another interesting statistic is what Nielsen calls reach – what percentage of adults are touched by a given media during the week. The leader in this category is radio that reaches 92% of adults at least once during a week. Next is live and time-shifted TV that reaches 87% of us. Smart phone apps reach 78% of adults during a week, and Internet on a computer reaches 54% of people each week.
There are some other interesting statistics in the report. 24% of households now have a smart speaker device like the Amazon Echo. That’s pretty amazing for a technology that didn’t exist just three years ago. 19% of adults listen to a podcast each week. 15% of us now listen to satellite radio. I would guess that many people would think that social media has overtaken our lives, but the average adult spends 44 minutes per day on a social media platform.
Another interesting statistic is how we watch TV. Almost 83% of adults watch TV in some manner. 81% of them still watch traditional cable TV; 13% watch TV using an antenna and 6% watch TV on the Internet. It’s easy for us in the Industry to think that Internet TV has taken over the industry, but most households are still watching TV the traditional way. This statistic should scare network planners because it highlights the huge amount of video that could transition to online in the future.
Of course, none of us are average and I doubt that anybody that reads this matches the overall statistics. Like other baby boomers I grew up in a time when the only media available was TV and radio and it’s always interesting to pause and consider the huge number of options we have today. These options mean we all use media in our own individual way. It’s still interesting, though, to see how our individual use of media aggregates into a national average – which is what drives the telecom industry we work in.
One reply on “Americans Love Their Media”
[…] via Americans Love Their Media — POTs and PANs […]